Jun
08
May 2016 in Spamtraps: ESPs
Just in time for M³AAWG 37 (Philadelphia, PA, Jun 13 to 16) – looking forward to meeting you all in person again!
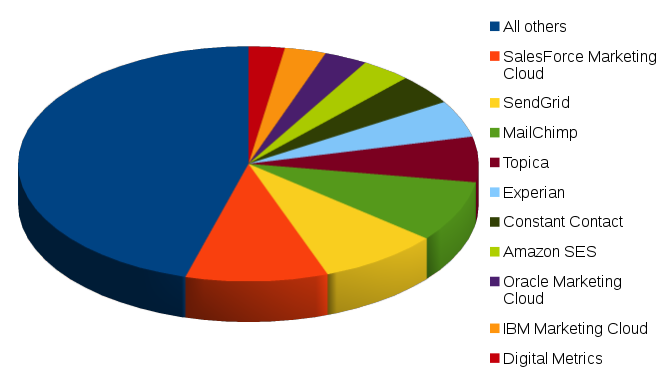
The percentage of ESP sent mail vs all mail seen in the spamtraps is higher than usual this month, 2.3%. It looks like this has to do with botnets either doing less or being better avoided on the platform that handles the stuff.
Social networks account for 4.2% of all mail, of which over 88% is Facebook. The Facebook trend may in fact be downwards, “only” sending 1.7 times as much mail as all tracked ESPs combined this month.
| RATING | PARTICIPANT | PERCENTAGE | NOTES | MOST PROMINENT CUSTOMER |
|---|---|---|---|---|
| 0 | All others | 46.9% | ||
| 1 | SalesForce Marketing Cloud | 10.7% | ExactTarget | Sony Brazil (~15%) |
| 2 | SendGrid | 8.3% | Yelp (<4%) | |
| 3 | MailChimp | 6.7% | 91% MC proper, 9% Mandrill (being phased out) | fantasibiksen.com (anonymous spammer) (<3%) |
| 4 | Experian | 5.6% | Target (<10%) | |
| 5 | Constant Contact | 4.2% | Advisor Perspectives (<40%) | |
| 6 | Topica | 3.8% | Will no longer be considered an ESP following SBL298675 | e-dailydealalerts (<65%) |
| 7 | Amazon SES | 3.6% | buyvip.com (<7%) | |
| 8 | Oracle Marketing Cloud | 3.5% | Responsys, Eloqua and RightNow | Bauer Media, UK (~15%) |
| 9 | IBM Marketing Cloud | 3.1% | Silverpop | Alpha Omega Publications (<7%) |
| 10 | Rackspace Mailgun | 1.9% | F1 Forum, Finland (~10%) |
Bubbling under: Epsilon, mySMTP (DK) and Blue Hornet, at 1.7%, 1.6%, 1.5% respectively.
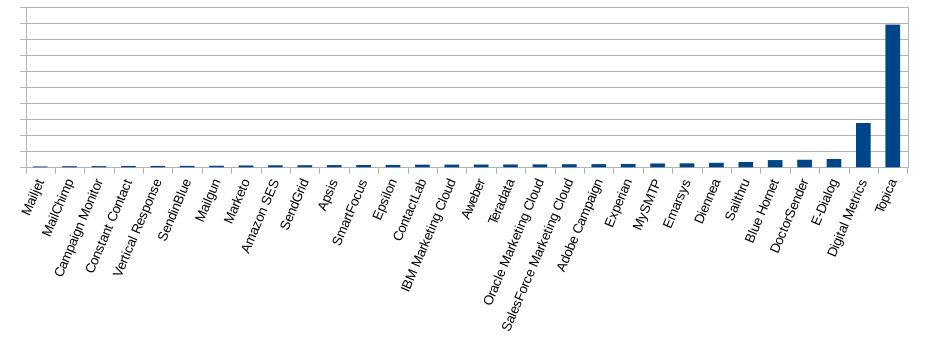
Here’s the “relative badness” graph.
Finally, the “top spamming customers” table.
| RATING | CUSTOMER | ESP | % OF THIS ESP | % OF ALL MAIL |
|---|---|---|---|---|
| 1 | e-dailydealalerts | Topica | 65% | 2.5% |
| 2 | advisorperspectives.com | Constant Contact | 39% | 1.7% |
| 3 | e.sony.com.br | Salesforce Marketing Cloud | 15% | 1.6% |
| 4 | Toys’R’Us | Epsilon | 50% | 0.8% |
| 5 | emailaddicts | Topica | 20% | 0.8% |

