Jul
19
June 2016 in Spamtraps: ESPs
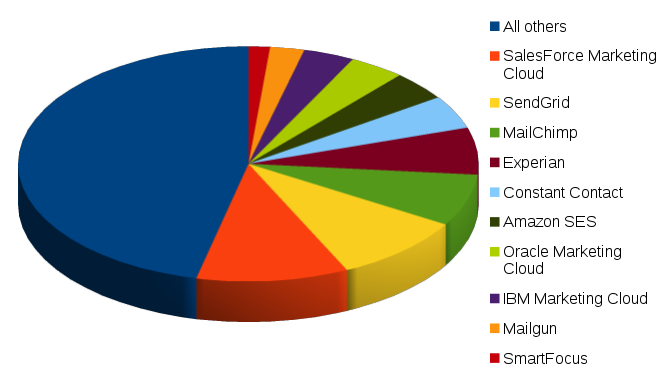
ESP mail seen in spamtraps June 2016
Long overdue – summer holidays and all that, but here we go.
The percentage of ESP sent mail vs all mail seen in the spamtraps keeps growing, 2.4%. The amount of ESP mail was 2% lower than last month, but the total amount of mail was down 8%. I’m no longer paying attention to social networks as it’s pointless – the point has been made.
| RATING | PARTICIPANT | PERCENTAGE | NOTES | MOST PROMINENT CUSTOMER |
|---|---|---|---|---|
| 0 | All others | 45.7% | ||
| 1 | SalesForce Marketing Cloud | 10.5% | ExactTarget | Sony Brazil (down to 2.6%) |
| 2 | SendGrid | 9.2% | mandmglobalgroup.com (anonymous dom reg) (~4%), with Sanoma Finland following closely (wth) | |
| 3 | MailChimp | 7.0% | 93% MC proper, 7% Mandrill (being phased out) | fynd[ck]ompa(g|)niet.se (~2%), with Freemiummedia Finland following closely (wth) |
| 4 | Experian | 6.4% | Target (~8%) | |
| 5 | Constant Contact | 4.5% | Advisor Perspectives (still at ~40%) | |
| 6 | Amazon SES | Just above 3.9% | 7dayshop.com (~7%) | |
| 7 | Oracle Marketing Cloud | Just short of 3.9% | Responsys, Eloqua and RightNow | markavip.com (~8%) |
| 8 | IBM Marketing Cloud | 3.5% | Silverpop | The DCCC (>9%) with Hillary Clinton following a close second |
| 9 | Rackspace Mailgun | 2.4% | F1 Forum, Finland (~8%) | |
| 10 | SmartFocus | 1.5% | EmailVision | mydealsonthego.co.uk (well over 20%) |
Bubbling under: Sailthru, Epsilon, and Marketo, at slightly less than 1.5%, 1.4% and 1.3% respectively.
Here’s the “relative badness” graph, a little easier to read now that the Topica outlier is gone.
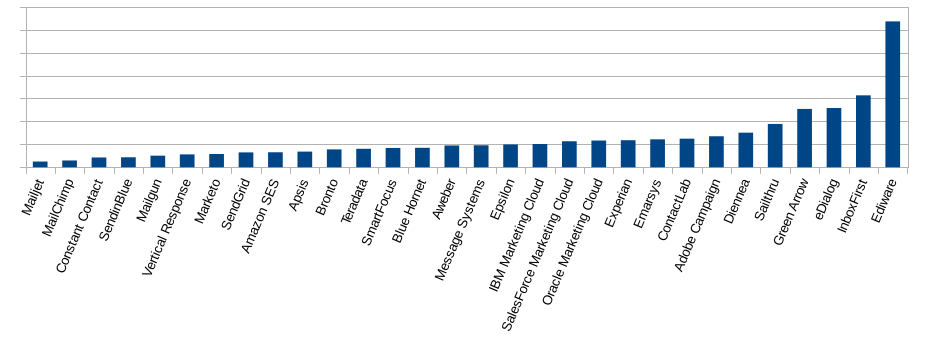
Amount of messages per separate customer of ESP, June 2016
Finally, the “top spamming customers” table.
| RATING | CUSTOMER | ESP | % OF THIS ESP | % OF ALL ESP MAIL IN SPAMTRAPS |
|---|---|---|---|---|
| 1 | advisorperspectives.com | Constant Contact | 39% | 1.8% |
| 2 | Target | Experian | 8% | 0.5% |
| 3 | Zillow | Message Systems (SparkPost) | 36% | 0.4% |
| 4 | mandmglobalgroup.com | SendGrid | 4% | 0.4% |
| 5 | The Democratic Congressional Campaign Committee | IBM Marketing Cloud | 9% | 0.3% |
Atro, Catherine, thanks for publishing these monthly metrics. They are interesting benchmarks, and also help us ESPs identify blind spots in our processes and systems so we can make improvements. In a future blog post, would you please provide some demographic information about your spam trap collection? (Geographic concentrations, domain types (enterprise, SMB, consumer service, personal), industry verticals that the traps represent, and trap types (repurposed vs. pristine vs. typo)). That’ll help us more deeply understand the types of traffic you’re reporting on. Thanks again for your good work.
Paul, thank you for the comment and feedback.
The spamtrap composition is always a moving target as we are adding new domains and in some cases letting go of others. The presentation you helped me give in Dublin (for which the notes ought to be available to members) contains a snapshot of some of that information as it was during the spring of 2015. I don’t think I’ll start a new blog series solely dedicated to revealing information about the spamtraps to the whole world, though.