Long-term ESP performance in spamtraps
A collaborator inspired me to draw a few more graphs (you know who you are, and thank you very much for the idea).
I had retained the numbers for the ESP blogs ever since May, so it occurred to me that it might be pertinent to do a time series. The graphs are expressed in percentages against the total amount of ESP spam received, so the growth of total volume (for example, as a result of adding more spamtraps) is already accounted for. Since the data points are naturally mostly at the low end of the scale, a logarithmic scale seemed appropriate.
So, please find enclosed three graphs of ESPs appearing in spamtraps, divided into Transactional, SMB Marketing and Enterprise Marketing. The selection of ESPs and their division to these three categories is according to the ideas of the collaborator. NB. We only started tracing Zeta Interactive in August.
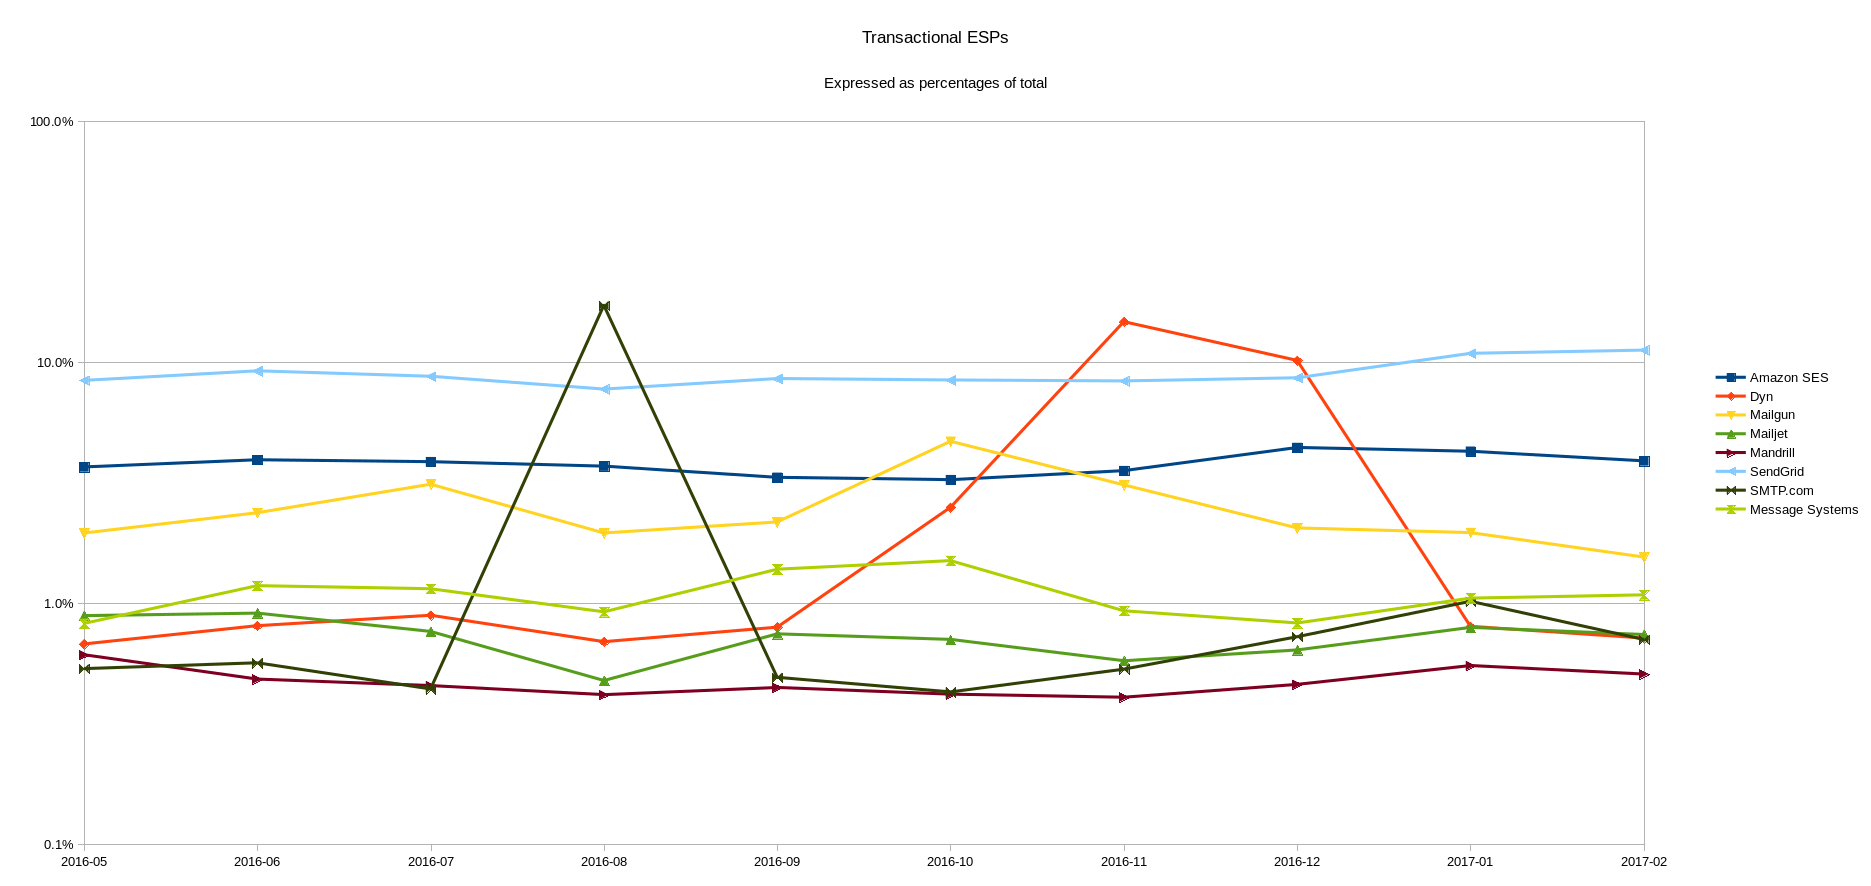
Transactional ESPs in Spamtraps, May 2016 to Feb 2017

SMB Marketing ESPs in Spamtraps, May 2016 to Feb 2017
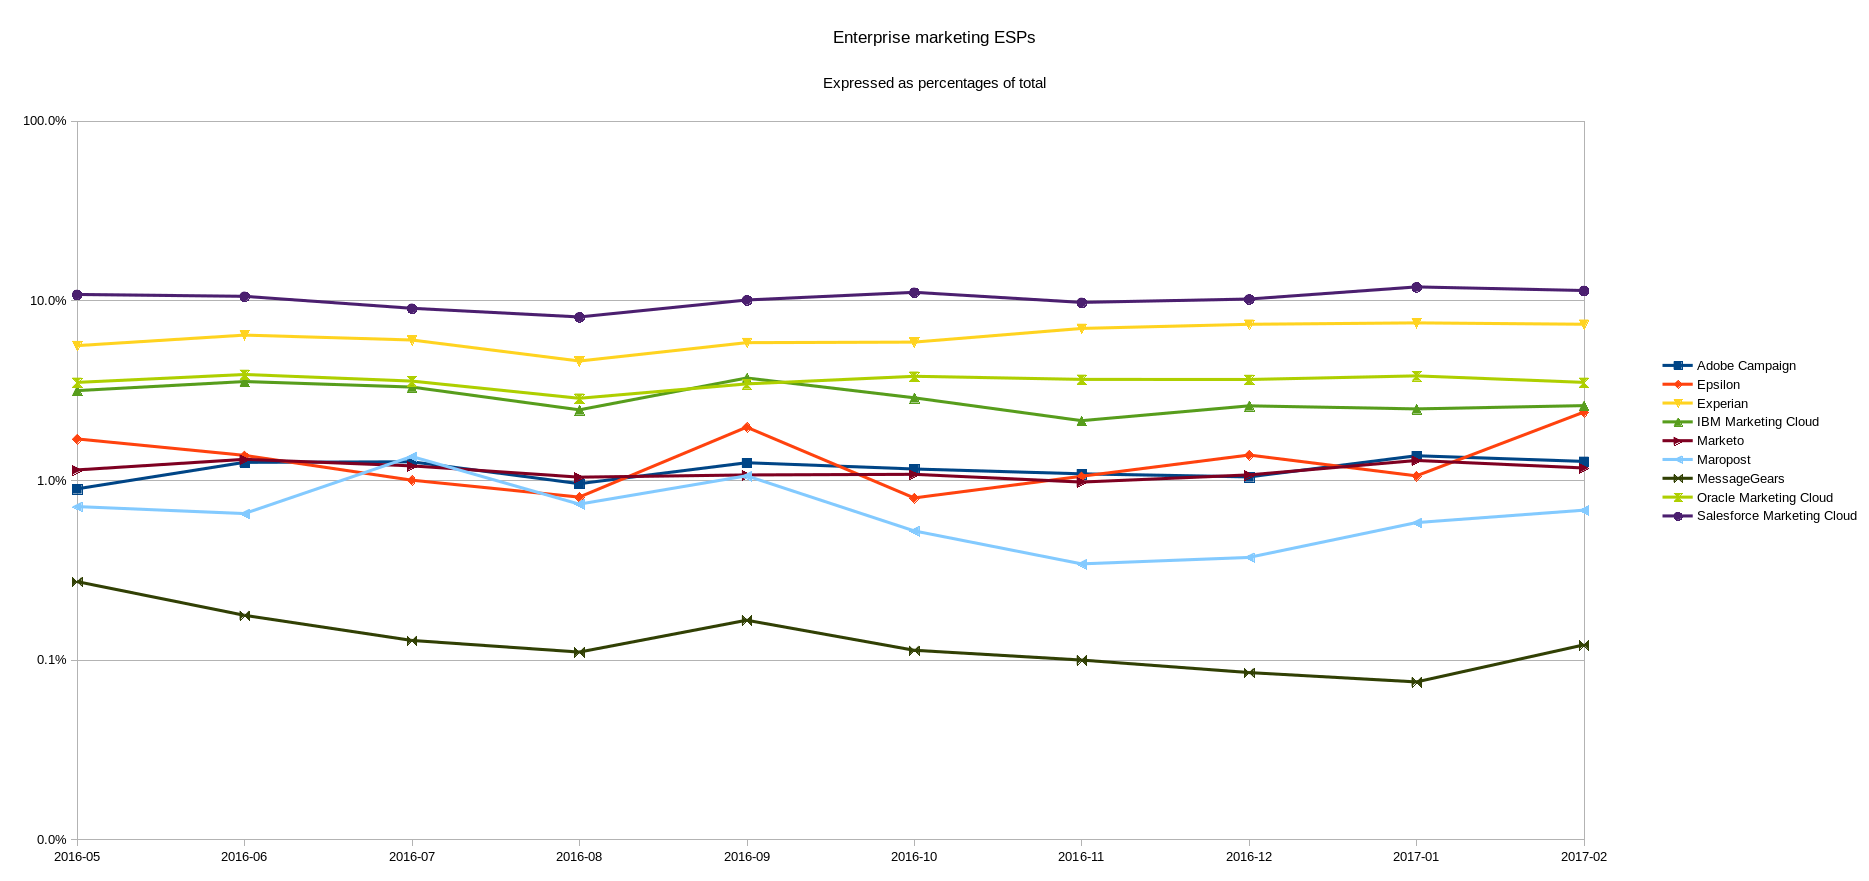
Enterprise Marketing ESPs in Spamtraps, May 2016 to Feb 2017