Aki seems to have some skill in cleaning up, but he’d need m4d $k1llz. This is a spam sent by and on behalf of Suomen Markkinointirekisteri Oy (www, biz reg), one of the Finnish peddlers of purchased email lists.
SendGrid, whose Email and Communications Policy forbids the use of the same, should clean him up pretty soon, I imagine. (In fact I received their report of the same during the writing of this post.) I must admit I’m a little disappointed that they haven’t crosschecked their customer base enough to spot Markkinointirekisteri’s presence before I did.
“Ei roskapostia, kaikki eivät halua sähköpostimainontaa!” is Aki’s slogan. Translation: “No junk email, not everybody wants email marketing!”. So true. I suppose it does not occur to you, Aki, that all unsolicited bulk email is junk email, and that your entire business is built around sending junk email and facilitating others doing the same?
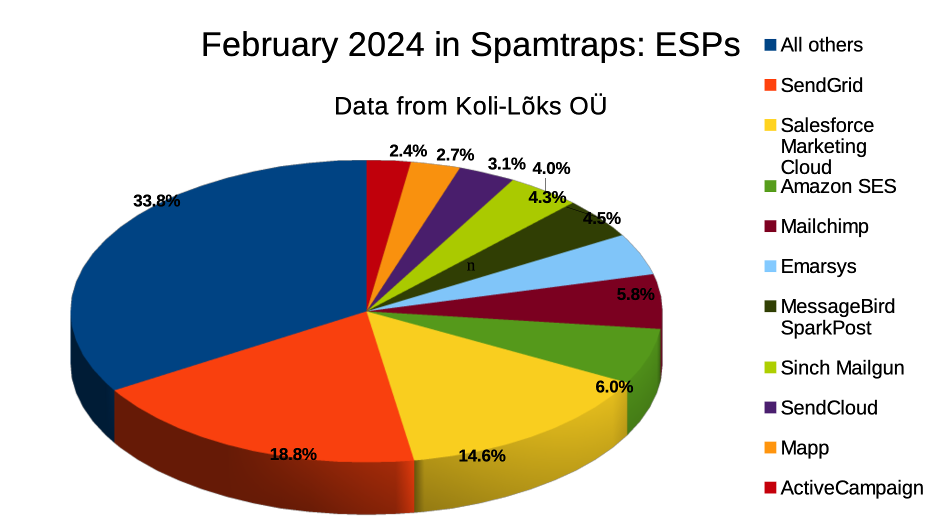
So here, at long last, the monthly stats for ESPs in the Koli-Lõks OÜ spamtrap collection. The percentage of ESP spam out of all email received was 13.9%.
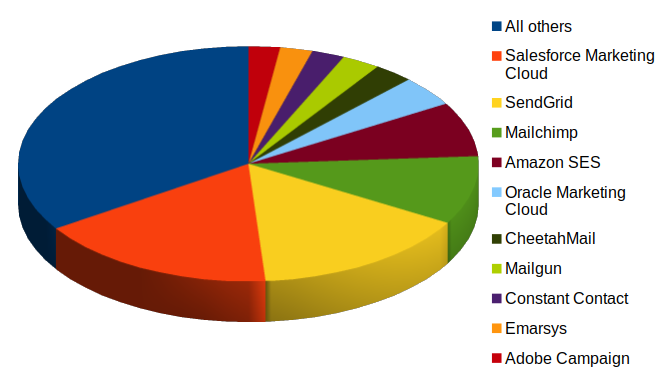
Figure 1. ESP spam in Koli-Lõks OÜ spamtraps, February 2024
Or, to put the same in readable text,
#
Name
Percentage
Most prominent customer
Notes
0
(All others)
33.8%
1
SendGrid
18.8%
infotimes.com.tw
2
Salesforce Marketing Cloud
14.6%
Sam’s Club
3
Amazon SES
6.0%
Terrie O’Connor Realtors
4
Intuit Mailchimp
5.8%
citistore.com.hk
5
Emarsys
4.5%
Costco Wholesale (UK)
6
MessageBird SparkPost
4.3%
Best Target Advertising Ltd (IE)
7
Sinch Mailgun
4.0%
Pandora
8
SendCloud (uCloud)
3.1%
f-avis.top
Newcomer in these postings
9
Mapp
2.7%
nextwebbusinessguide.com
Includes eCircle and Blue Hornet
10
ActiveCampaign
2.4%
wrenews.com
Table 1. List of the most frequently seen ESPs.
The last time SendGrid was NOT number 1 in these stats was May 2021. Incidentally, that’s the previous time this blog was updated.
Amazon SES has more or less permanently taken over from Mailchimp as #3.
The entry of the Chinese ESP SendCloud / uCloud to these lists did in fact happen earlier, but it seems we’ve only tweeted about that at the time.
Here’s a list of the individual customers with the most volume from the whole bunch, their percentages out of the total ESP mail load, their respective ESPs, and their percentages out of their own ESP:
#
Customer name
Pct out of total ESP mail
On which ESP
Pct out of own ESP
Name
1
infotimes.com.tw
2%
SendGrid
10.9%
時報資訊股份有限公司
2
viaggioas.com
1%
SparkPost
23.4%
Best Target Advertising Ltd, Ireland
3
nextdoor.com
0.7%
SendGrid
3.8%
Nextdoor
4
lager157.com
0.7%
SendGrid
3.7%
Lager 157
5
tocr.com
0.6%
Amazon SES
10.3%
Terrie O’Connor Realtors
6
nrsc.org
0.6%
SendGrid
3.1%
National Republican Senatorial Committee
7
uber.com
0.4%
SendGrid
2.3%
Uber
8
samsclub.com
0.3%
SFMC
2.3%
Sam’s Club
9
costco.co.uk
0.3%
Emarsys
7.3%
Costco Wholesale (UK)
10
italotreno.it
0.3%
Adobe Marketo
14.2%
Italo, Italy’s high speed train
Table 2. List of the most frequently seen ESP customers.
You know where to reach us if you want to ask questions about this (that is, in case you don’t want it discussed in public in the comments to the blog). TTFN!
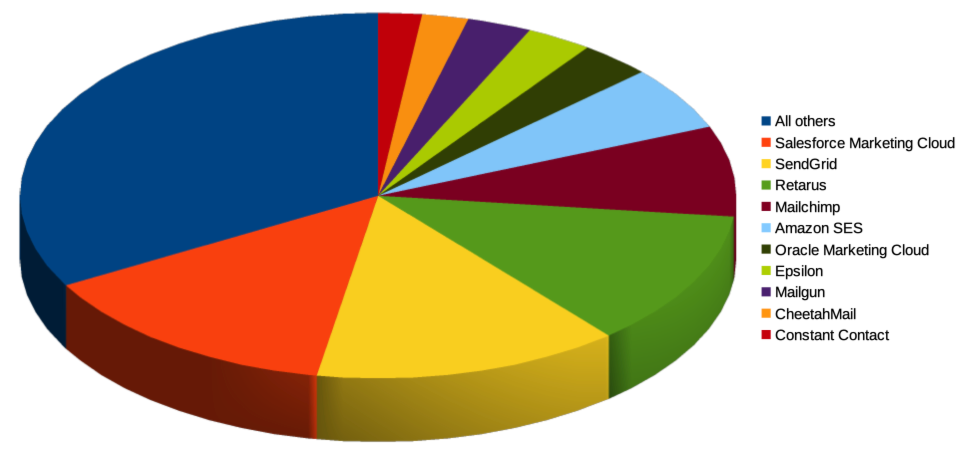
Here’s a monthly summary of our findings in May 2021. Because of a major glitch at an otherwise unremarkable operator the total of ESP mail is noticeably larger than the month before (from 6.6% to 6.8%), the top 10 has a new participant that would never appear on the list otherwise, and the share of the top 10 out of everything is much larger than usual.
Rating
Participant
Percentage
Notes
Most prominent customer
0
All others
33.2%
1
Salesforce Marketing Cloud
14.1%
Marcus & Millichap (4%)
2
SendGrid
13.9%
Uber (7.2%)
3
Retarus
12.0%
Mostly backscatter
MAILER-DAEMON (99%)
4
Mailchimp
8.0%
Egyeditermekek.net (0.9%)
5
Amazon SES
5.7%
Netflix (9.3%)
6
Oracle Marketing Cloud
3.2%
Harborfreight.com (3.5%)
7
Epsilon
3.0%
DICK’S Sporting Goods, Inc. (57.5%)
8
Mailgun
2.9%
With some spillover from Mailjet
Harri.com (3.3%)
9
CheetahMail
2.1%
Talbots.com (11.4%)
10
Constant Contact
2.0%
Rentv.com (1.5%)
Table 1. Top 10 ESPs in our spamtraps, May 2021, with their shares of the total and most prominent customers
This month’s special feature is a flood of backscatter from Retarus, a German ESP whose presence in our traps is usually so insignificant that they’re not even in the top 40. Early this month, there were two outbursts of this activity, between 7 to 11 am UTC on May 3 and between 3 to 7 am UTC on May 6. It is only the second time that backscatter causes an ESP to make an appearance here, the first, if memory serves, having been Hobsons in July 2018.
After taking a closer look last period, I noticed that our handling of the merged operations of Mailgun and Mailjet is somewhat wonky, which explains the appearance of any given customer on both at the same time. To be honest, it doesn’t help that they appear to be borrowing IP blocks from each other. But this is a problem that I expect will resolve itself in the short to medium term as the merger is eventually completed (one hopes, anyway).
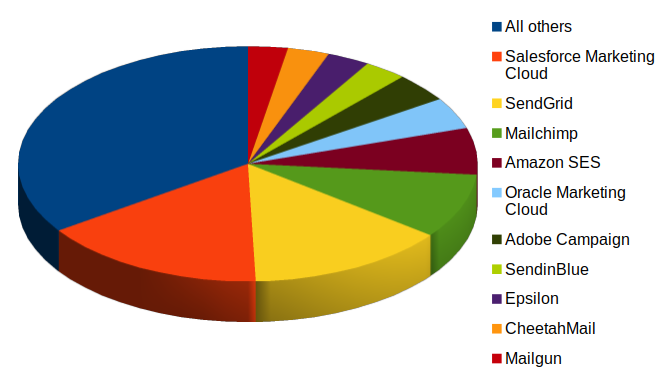
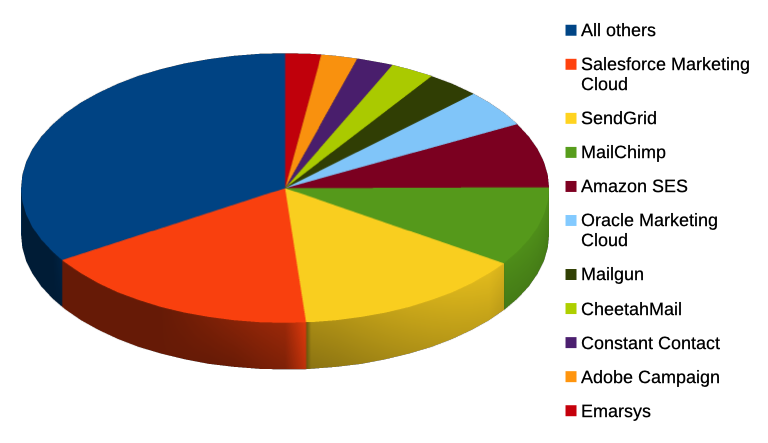
Okay, so here’s the last post of 2020, a day or two late.
It really seems as if the SendGrid flood that there was during the autumn is over. There’s still a lot of mail, and some of it is still stuff that no ESP customer should be sending, but the numbers are more or less back to normal, which is nice.
RATING
PARTICIPANT
PERCENTAGE
NOTES
MOST PROMINENT CUSTOMER
0
All others
33.9%
259 ESPs identified
1
Salesforce Marketing Cloud
15.6%
Marcus & Millichap (3.5%)
2
SendGrid
13.8%
Uber (7.0%)
3
Mailchimp
8.7%
Spamtrap bias showing
Akcióbazár (<1%)
4
Amazon SES
6.3%
Netflix (4.9%)
5
Oracle Marketing Cloud
4.2%
harborfreight.com (3.7%)
6
Adobe Campaign
3.9%
Pandora (49%)
7
SendinBlue
3.0%
sneakyaffiliate.com (10%)
8
Epsilon
>2.9%
DICK’S Sporting Goods (40%)
9
CheetahMail
<2.9%
Talbots (7.7%)
10
Mailgun
2.7%
Vumedi.com (3.3%)
Table 1. Top 10 ESPs in our spamtraps, December 2020, with their shares of the total and most prominent customers
We’ve done something strange, or spammers have done something strange, I don’t know. The proportion of ESP spam to all spam we’ve seen keeps growing. The numbers remain more or less the same, while the total goes down, so I guess either the botnets are spewing less, or we’re ignoring them better. The percentage of ESP spam to all was a whopping 8.1% this month.
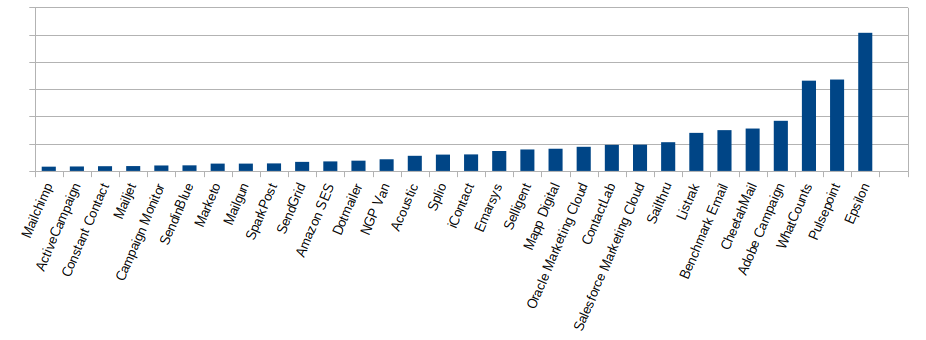
Then there’s the relative badness.
Figure 2. Relative badness of ESPs in our spamtraps, December 2020
As always, the “relative badness” figure is obtained by dividing the total number of messages sent to us by an ESP by the apparent number of its customers participating in it.
The biggest customers in the badness chart are DICK’S Sporting Goods for Epsilon (almost 40% of Epsilon’s total catch in our traps); the Republican party (over 70% of what Pulsepoint sent); Costco (over a third of what we got from WhatCounts) and Pandora, which amounted to almost half of the Adobe contribution.
That’s all, folks! Happy New Year, may it be less interesting in the Chinese sense than the one we just left behind.
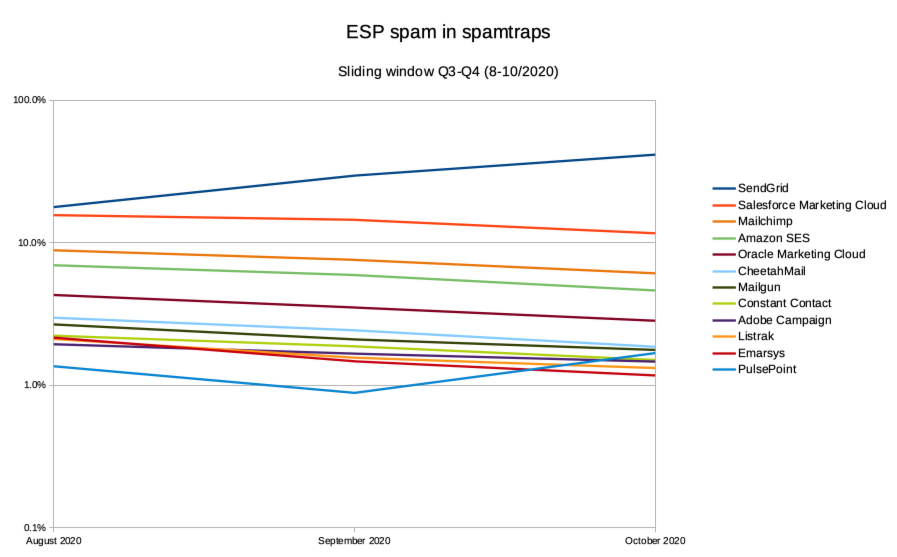
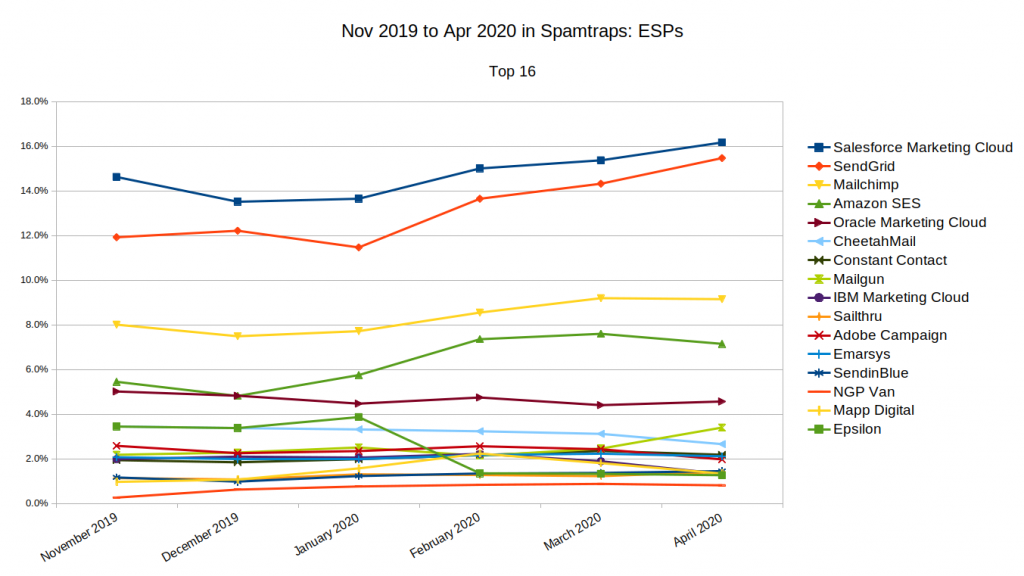
This follows the earlier July to September post – the trends continue to be more important than the spot figures. The percentage of ESP spam of all mail was 9.7% in October.
Figure 1. Percentages of various ESPs of the total catch identified as having been sent by any ESP, August to October 2020Read more…
Turns out there was a point to being lazy with the monthly reports over the summer. This chart needed to be drawn over a longer period of time to highlight the obvious.
Another case of “didn’t get a round tuit for some time”
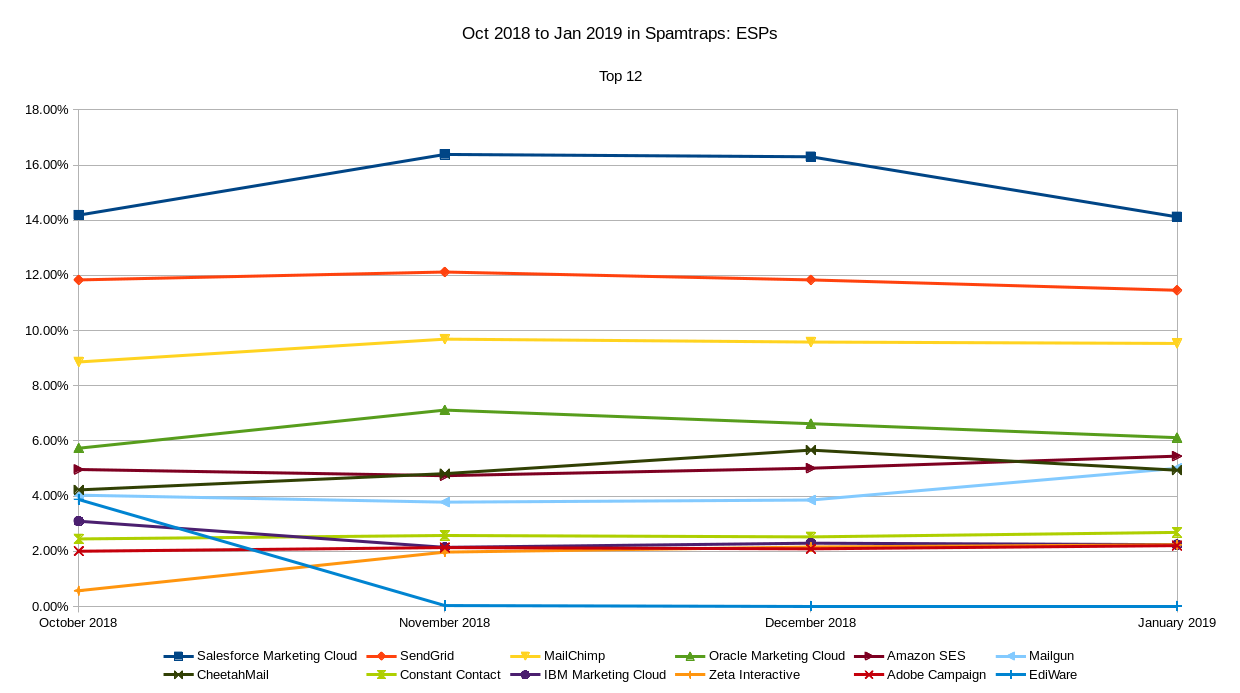
ESP spam seen in spamtraps, October 2018 to January 2019
Another couple of months have passed by so quickly and I only just found I had even completed the October report but forgotten to release it…
The percentages of ESP spam in the traps were, respectively, 3.0%, 3.4%, 3.0% and 2.8% during this period.
Ediware disappeared back into the void it had come from after the Oct 24 disaster. All other operations on the list are household names.
Salesforce keep increasing their lead over the competition.
I am pleased to see that SendGrid made Advisor Perspectives disappear after the very beginning of November. Nobody could guess what explains the simultaneous rise in Zeta Interactive’s spam output, from relative obscurity (#28 in October) to #11 in November and the Top Ten in December-January.
Looking forward to seeing you all in San Francisco in a few weeks!